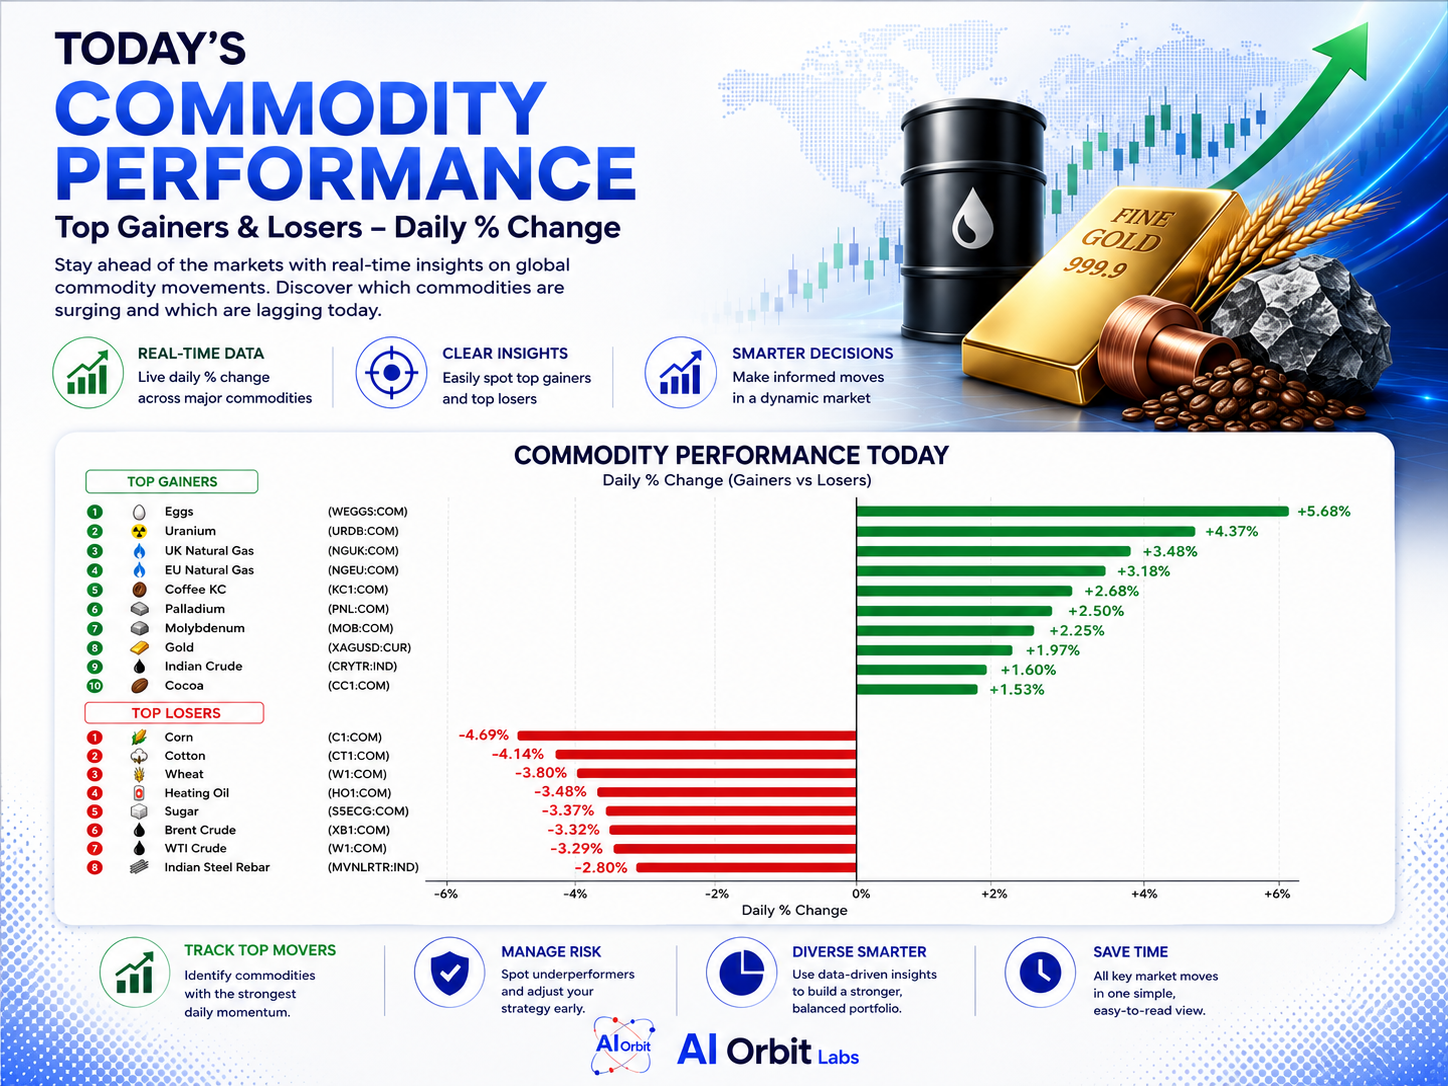
Global commodities experienced a dramatic divergence on July 24, 2026, as supply shocks, geopolitical tensions, and macroeconomic forces created clear winners and losers across the spectrum. While eggs and uranium surged to multi-year highs on structural supply constraints, grains tumbled on ample stockpiles. Energy markets faced a complex picture, with natural gas spiking on Middle East tensions, while crude oil dipped on oversupply concerns.
This comprehensive analysis examines the key drivers behind each major commodity's price action and provides actionable insights for traders and investors.
The Big Picture: Three Key Driver Categories
Before diving into individual commodities, it's essential to understand the three main categories of catalysts driving the July 24 moves:
1. Supply Shocks
-
Avian Influenza (Bird Flu): Devastating poultry losses continuing to tighten egg supplies
-
Weather Events: West African rains, Brazilian dry spells impacting coffee and cocoa
-
Mining Constraints: Long lead times for uranium and palladium new supply
2. Geopolitics
-
Iran–USA Conflict: Escalating tensions disrupting global energy flows, particularly natural gas and oil
-
Middle East Instability: LNG supply routes threatened, lifting European gas prices
-
Energy Security Concerns: Renewed focus on nuclear power and alternative energy sources
3. Macro Factors
-
Federal Reserve Policy: Rate expectations influencing gold and dollar-denominated commodities
-
Inflation Concerns: Driving precious metals and safe-haven demand
-
Global Demand Dynamics: Weak demand for grains vs. firm demand for energy and metals
Winners: Commodities Rallying on Supply Constraints
Eggs (WEGGS): +5.7% – The Bird Flu Crisis Intensifies
Price Action: +5.7% intraday, making eggs the strongest performer of the session.
The Supply Crisis: Egg prices have been at record highs as Highly Pathogenic Avian Influenza (HPAI), commonly known as bird flu, continues to devastate layer flocks across the United States.
-
Losses Since 2022: Over 166 million laying hens have been lost to HPAI
-
Inventory Impact: Domestic egg inventories cut by approximately 11-12%
-
Wholesale Prices: USDA Grade A large eggs up $0.28 to $1.05 in New York, reaching $1.40 in California
-
Cage-Free Eggs: Even higher premiums
-
Year-over-Year: Farm Bureau reports egg prices up approximately 350% YOY
-
USDA Average: January 2026 average at $4.95/doz, compared to ~$1.16 a year earlier
Seasonal Factors: High-summer grilling, baking, and holiday promotions are further supporting demand at a time of extremely constrained supply. Frozen egg stocks remain unchanged month-to-date, indicating minimal storage buffer.
Rebalance Timeline: Rehatching and flock recovery will require approximately 6-9 months, suggesting prices will remain elevated well into late 2026.
Trade Idea: LONG (supply-constrained, inelastic demand, multi-month rebalancing)
Uranium (URDB): +4.4% – Nuclear Renaissance Accelerates
Price Action: +4.4% intraday, near multi-year highs.
The Nuclear Surge: Uranium prices are benefiting from a perfect storm of surging nuclear demand and heightened geopolitical risk.
-
Current Spot Price: ~$86/lb for U₃O₈
-
2027 Contract Prices: ~$90/lb
-
Bank of America Target: $135/lb by 2027
-
Supply Constraints: Current primary mining barely meets demand
-
Lead Times: Any new mine requires approximately 7-12 years to develop
-
Major Suppliers: Kazatomprom and Cameco are near full capacity
Geopolitical Drivers: The Middle East conflict has refocused attention on energy security, with nuclear power viewed as a strategic alternative to volatile oil and gas supplies. As CruxInvestigator notes, we are witnessing an energy-security "renaissance" for nuclear fuels.
Rebalance Timeline: Long-term (years), as new mining capacity takes considerable time to develop.
Trade Idea: LONG (structurally bullish, long-term supply-demand imbalance)
UK Natural Gas (NGUK): +3.5% – War and Heatwave Collide
Price Action: +3.5% intraday, reaching approximately 155 pence/therm (4-month high).
The Perfect Storm: UK gas prices surged as stormy Middle East events and record European heatwaves created a severe supply-demand imbalance.
-
Price Level: Above 150 p/thm for the first time in four months
-
July Performance: UK gas has risen approximately 44% in July alone
-
Key Catalysts: 13th consecutive night of US strikes on Iran
-
LNG Disruption: Curb on Persian Gulf LNG flows
-
Weather Impact: Sweltering weather across Europe boosting electricity demand for cooling
Storage Concerns: Equinor warns Europe may miss its 80% storage target for winter, underscoring the tightness in the market. US LNG exports have been disrupted by war risk, even as domestic US storage remains near normal levels.
Seasonal Factors: Summer heat has pushed cooling demand to record levels, while low storage (around 90% full vs. 95% target) has left markets highly sensitive.
Rebalance Timeline: Short-term (months), with winter filling the critical period.
Trade Idea: LONG (prices likely remain elevated into winter)
EU Natural Gas (NGEU): +3.2% – Mirroring UK Tightness
Price Action: +3.2% intraday, with front-month German/NWE gas hitting approximately €64/MWh (highest since January 2023).
The European Context: The European gas market mirrored the UK's surge, driven by identical factors.
-
War Impact: The conflict has cut LNG flows significantly
-
Qatar Export Halt: A key Iran ally, removed approximately 20% of global LNG
-
Price Impact: Briefly lifted EU prices approximately 50% in early March
-
Renewed Tensions: Gulf tensions in July (tanker attacks) again disrupted shipments
-
Demand Surge: Peak summer demand for cooling
Storage Reality: EU stocks are well below seasonal norms, making prices exceptionally sensitive to any supply disruption.
Rebalance Timeline: Short-term (until winter rebuild), with high volatility on any conflict or deal news.
Trade Idea: LONG (high volatility on any conflict or de-escalation news)
Coffee (KC1): +2.7% – Weather-Driven Rally
Price Action: +2.7% intraday, with Arabica (New York) trading near 317¢/lb.
Weather Disruptions: Coffee futures have been lifted by adverse weather conditions in major producing regions.
-
Brazilian Harvest Disruption: Wet weather delaying picking in the world's largest producer
-
July Rally: CropGPT reports arabica rallied approximately 10% by July 10
-
Vietnamese Struggles: Dry spells impacting robusta production
-
Quality Concerns: Rainfall timing affecting bean quality
Seasonal Factors: July-September is the main Brazilian harvest period, making weather forecasts critical.
Demand: Global coffee consumption continues to rise approximately 2% annually, providing underlying support.
Rebalance Timeline: Seasonal (months to next harvest)
Trade Idea: LONG (weather premium has return; watch El Niño forecasts)
Palladium: +2.5% – Safe-Haven Flows and Industrial Demand
Price Action: +2.5% intraday, benefiting from both safe-haven and industrial demand.
Dual Drivers:
-
Geopolitical Safe-Haven: Middle East tensions driving risk-off flows
-
Industrial Demand: Auto catalytic converters and electronics sector recovery
Supply Constraints:
-
Major producers: Russia and South Africa
-
Sanctions or strikes could disrupt output
-
Little spare mine capacity available
Trade Idea: LONG (positive risk premium, tight supply)
Molybdenum: +2.3% – Industrial Demand Support
Price Action: +2.3% intraday, reflecting broader base-metal strength.
Key Drivers:
-
Steel Sector Demand: Used in steel alloys and industrial applications
-
Geopolitical Friction: Argus Intelligence notes that "geopolitical friction" (US-China trade, environmental curbs) can disrupt supply chains
-
Growing Demand: Global moly demand increasing with steel production
Supply: Neutral (some growth planned, close to balanced)
Rebalance Timeline: Multi-year
Trade Idea: NEUTRAL (lack clear catalyst; watch steel/EV trends)
Gold (XAU): +2.0% – Mixed Safe-Haven Signals
Price Action: +2.0% intraday, with approximately $100 moves on any risk news.
The Gold Dilemma: Despite war-driven safe-haven flows, gold's reaction has been mixed due to:
-
Rising Yields: Higher bond yields pressuring non-yielding gold
-
Dollar Strength: A strong USD typically weighs on gold
-
Inflation Expectations: Higher oil-driven inflation creates both support (inflation hedge) and headwinds (Fed tightening)
Major Influences:
-
Iran conflict provides safe-haven support
-
US bond yields (higher yields pressure gold)
Supply: Stable (mining output steady)
Trade Idea: NEUTRAL (mixed signals; keep risk balanced)
Cocoa (CC1): +1.5% – West African Floods Impact Supply
Price Action: +1.5% intraday after a stormy week.
Weather Crisis:
-
Early-July floods in Ivory Coast/Ghana (world's largest producers)
-
ICE futures hitting 24-week highs
-
Huanda Cocoa reported prices at $5,723/ton (+14% in one day)
-
Flooded fields and fungal disease risks
Seasonal Timing:
-
Mid-crop harvest is March-August in Ivory Coast/Ghana
-
Delays mean fewer early beans
-
Tightening supplies into main crop (October/November)
El Niño Risk: Hot dry Harmattan later in the year could further threaten production.
Rebalance Timeline: Several months (next harvest)
Trade Idea: LONG (spot risk premium high; monitor weather)
Corn (CO1): -4.7% – Oversupply Weighs Heavily
Price Action: -4.7% intraday, reflecting abundant supply.
Record Production:
-
Dec 1, 2025 Stocks: 13.30 billion bu (up 10% YOY)
-
2025 Crop: Record approximately 17.0 bbu
-
Absorption: Even with strong ethanol use and exports, inventories remain swollen
-
Seasonal: Post-harvest/early growing season tends to see corn soft
Key Reports: The July 2026 USDA WASDE (out July 12) and weekly export inspections.
Trade Idea: SHORT (fundamentals bearish, oversupply)
Cotton (CL1): -4.1% – Ample Global Stocks
Price Action: -4.1% intraday on weak demand.
Supply Glut:
-
Global Ending Stocks: ~71.2 million bales (historically ample)
-
US Harvest: Decent prospects
-
Chinese Demand: Relatively weak
-
Global A-Index Projected: ~78¢/lb (near 2025 levels)
Seasonal: Demand typically soft in Q3-Q4 as southern hemisphere harvest comes in.
Key Reports: USDA quarterly stocks (due October 2026), export demand figures.
Trade Idea: SHORT (structural oversupply limits rallies)
Wheat (W1): -3.8% – Large Carryover Weighs
Price Action: -3.8% intraday.
Abundant Supply:
-
US Stocks: 1.68 billion bu (+7% YOY)
-
Russian/Ukrainian Production: Rebounded (2024 peace restored flows)
-
Global Stocks: Ample
-
High Winter Wheat Yields: Combined with large carryover
Seasonal: July-August (end of US winter crop) often sees price pressure.
Key Catalysts: USDA crop reports (August), Black Sea export policies.
Trade Idea: SHORT (bearish fundamentals)
Heating Oil (HO1): -3.5% – Following Crude Lower
Price Action: -3.5% intraday, tracking crude oil's decline.
Context:
-
Soft despite peak summer consumption for diesel
-
Retail demand picks up in shipping/freight
-
Low refining runs globally
IEA Note: Product cracks (including gasoil) hit multi-year highs in early July, implying supply tightness, but oil's drop has weighed on forward HO prices.
Trade Idea: NEUTRAL
Sugar (S5ECC): -3.4% – Profit-Taking Eases Prices
Price Action: -3.4% intraday on profit-taking after early 2026 strength.
Complex Dynamics:
-
Early 2026 Strength: Higher oil (ethanol) prices diverted Brazil cane to fuel, tightening raw sugar supply
-
StoneX Projection: Global production robust (Brazil and Thailand output up)
-
Near-Term Tightness: Bigger ethanol mix in Q1 2026 may give way to plentiful supply by late 2026
Seasonal: October-January is Brazil/India harvest; upcoming yields should be watched.
Trade Idea: NEUTRAL (volatile; end-buyers should hedge)
Brent & WTI Crude: -3.3% Each – Oversupply vs. Geopolitics
Price Action: -3.3% intraday (Brent ~$96, WTI ~$89).
The Volatile Equation:
-
IEA Reports: Resumed flows through the Strait of Hormuz (ceasefire) led to supply flood
-
Brent Drop: Down ~$30 to ~$68/bbl by early July (lowest since January)
-
Ceasefire Break: US strikes on Iran (7-12 July) pushed Brent back to ~$77
-
Today's Drop: Likely reflects latest inventory builds and OPEC+ output increase
Key Reports:
-
EIA weekly (July 24) showed US crude stocks +X Mbbl
-
OPEC+ output increase (August cuts phased out)
Macro Factors: Fed policy and GDP data also influencing sentiment.
Trade Idea: NEUTRAL (market eye on news; short-term rallies fade if supply normalizes)
Indian Steel Rebar (MVNLRTR): -2.8% – Demand Cooling
Price Action: -2.8% intraday.
Key Factors:
-
Domestic Demand: Cooling amid higher interest rates and slowing infrastructure growth
-
Global Oversupply: Import competition persists
-
ProcurementResource Note: Late-2025 steel inventories building from cheap imports
-
Government Response: Duties imposed to cap imports, but pricing remains under pressure
Trade Idea: NEUTRAL/SHORT (structural overhang; watch domestic policy)
Iran–USA Conflict Timeline: Key Market-Moving Events
| Date | Event | Market Impact |
|---|---|---|
| February 28, 2026 | War breaks out (Khamenei killed) | Oil spikes, safe-haven buying |
| April 7, 2026 | Temporary ceasefire agreed | Oil drops, relief rally |
| April 17, 2026 | Iran briefly reopens Strait (ends days later) | Volatility |
| June 17, 2026 | US–Iran interim deal signed (Iran resumes oil exports) | Oil supply fears ease |
| July 7, 2026 | Iran strikes ships in Strait; US retaliates | Oil and gas surge |
| July 12, 2026 | US hits 140+ Iranian targets (war intensifies) | Energy spikes again |
This timeline (from AP) captures the flare-ups that moved markets. The February 28 attack shut a key Gulf chokepoint. Ceasefires in April-June briefly eased supply fears, but early July saw a return to conflict, pushing oil back up. Each escalation corresponded with jumps in crude, gas, and metals.
Comparative Summary Table
| Commodity | % Change | Primary Driver(s) | Supply Outlook | Rebalance Timeframe | Trade Idea |
|---|---|---|---|---|---|
| Eggs (WEGGS) | +5.7% | HPAI (bird flu) losses; inelastic food demand | Very tight | Several months (flock rebuild) | LONG |
| Uranium (URDB) | +4.4% | Nuclear demand surge; Iran war risk | Tight | Years (mining expansion) | LONG |
| UK Nat Gas (NGUK) | +3.5% | Middle East war & LNG supply; heatwave | Tight | Winter (2-6 mo) | LONG |
| EU Nat Gas (NGEU) | +3.2% | Iran conflict cuts LNG; record heat | Tight | Winter (2-6 mo) | LONG |
| Coffee (KC1) | +2.7% | S. American weather (Brazil, Vietnam) | Slightly tight | Harvest season (mo) | LONG |
| Palladium | +2.5% | Safe-haven flows; auto catalyst demand | Tight | Years (new mines) | LONG |
| Molybdenum | +2.3% | Industrial steel demand; supply-risk outlook | Neutral/tight | Multi-year | NEUTRAL |
| Gold (XAU) | +2.0% | War safe-haven vs. Fed/yield tensions | Neutral | n/a | NEUTRAL |
| Cocoa (CC1) | +1.5% | West Africa rains, crop fears | Tight | Harvest (4-5 mo) | LONG |
| Corn (CO1) | -4.7% | Record US output; large stocks | Loose | n/a | SHORT |
| Cotton (CL1) | -4.1% | Global surplus stocks; weak demand | Loose | n/a | SHORT |
| Wheat (W1) | -3.8% | Ample global carry; good yields | Loose | n/a | SHORT |
| Heating Oil (HO1) | -3.5% | Crude price weakness; seasonal lull | Neutral | n/a | NEUTRAL |
| Sugar (S5ECC) | -3.4% | Ethanol policy (tight now) vs. global output | Balanced | Harvest (mo) | NEUTRAL |
| Brent Crude | -3.3% | Oil flows resume (straits); demand uncertainty | Neutral/loose | Months | NEUTRAL |
| WTI Crude | -3.3% | Same (global oversupply vs. conflict) | Neutral/loose | Months | NEUTRAL |
| Indian Rebar | -2.8% | Steel demand cool; import pressure | Neutral/loose | Months | NEUTRAL |
Monitoring Checklist & Trade Risks
Geopolitics
-
Track Iran–USA conflict developments closely (diplomatic talks, strikes, sanctions)
-
Any ceasefire or further escalation will ripple through oil, gas, gold, and global risk sentiment
Supply Reports
-
USDA WASDE: Monthly updates for grains, oilseeds, cotton
-
EIA Weekly Petroleum & Gas Storage: Critical for energy markets
-
OPEC/IEA Monthly Reports: Global oil supply/demand balances
-
USDA Jan/Jun Grain Stocks: Confirm supply adequacy or stress
Weather
-
Brazil: Coffee and cocoa belt rains or frosts
-
US Midwest: Drought conditions for corn and wheat
-
El Niño Signals: Global weather pattern impact on agricultural commodities
-
West Africa: Rains and disease risks for cocoa
Macro
-
US Fed Policy: Rate expectations influencing precious metals and dollar
-
USD Strength: Impact on all dollar-denominated commodities
-
Global Growth Signals: GDP data affecting industrial metals demand
-
Bond Yields: 10-year Treasury influence on gold and silver
Influenza & Disease
-
Continue updates on avian influenza spread in poultry
-
New outbreaks would further tighten egg/meat markets
Energy Transitions
-
New nuclear projects (uranium demand)
-
Green energy push (affects oil and gas)
-
Biofuel mandates (Brazilian ethanol production, sugar)
Risk Considerations
-
Extreme Positioning: Gas and energy are priced for worst-case disruptions—any de-escalation could cause sharp pullbacks
-
Grain Reversals: Prices have priced in big crops; weather shocks could suddenly reverse downtrends
-
Metals Vulnerability: A hawkish Fed surprise could undercut gold and silver
-
High-Frequency Trading Risks: News headlines triggering knee-jerk moves
-
Diversification: Advisable given the volatile geopolitical backdrop
-
Hedging: Options or stop-losses recommended for active traders
Conclusion
The global commodities landscape on July 24, 2026, reflects a market sharply divided by structural supply constraints, geopolitical tensions, and macro forces. Winners such as eggs, uranium, and natural gas are driven by genuine supply tightness and inelastic demand, while grains and cotton suffer from record production and ample stockpiles.
The Iran–USA conflict remains the single most important wildcard, with its impact rippling across energy, precious metals, and risk sentiment. Weather patterns are increasingly critical for agricultural commodities, with West African rains, Brazilian harvest conditions, and El Niño forecasts demanding close attention.
For traders and investors, the key lies in maintaining discipline, monitoring the checklist of catalysts outlined above, and being prepared for continued volatility as these divergent trends play out.