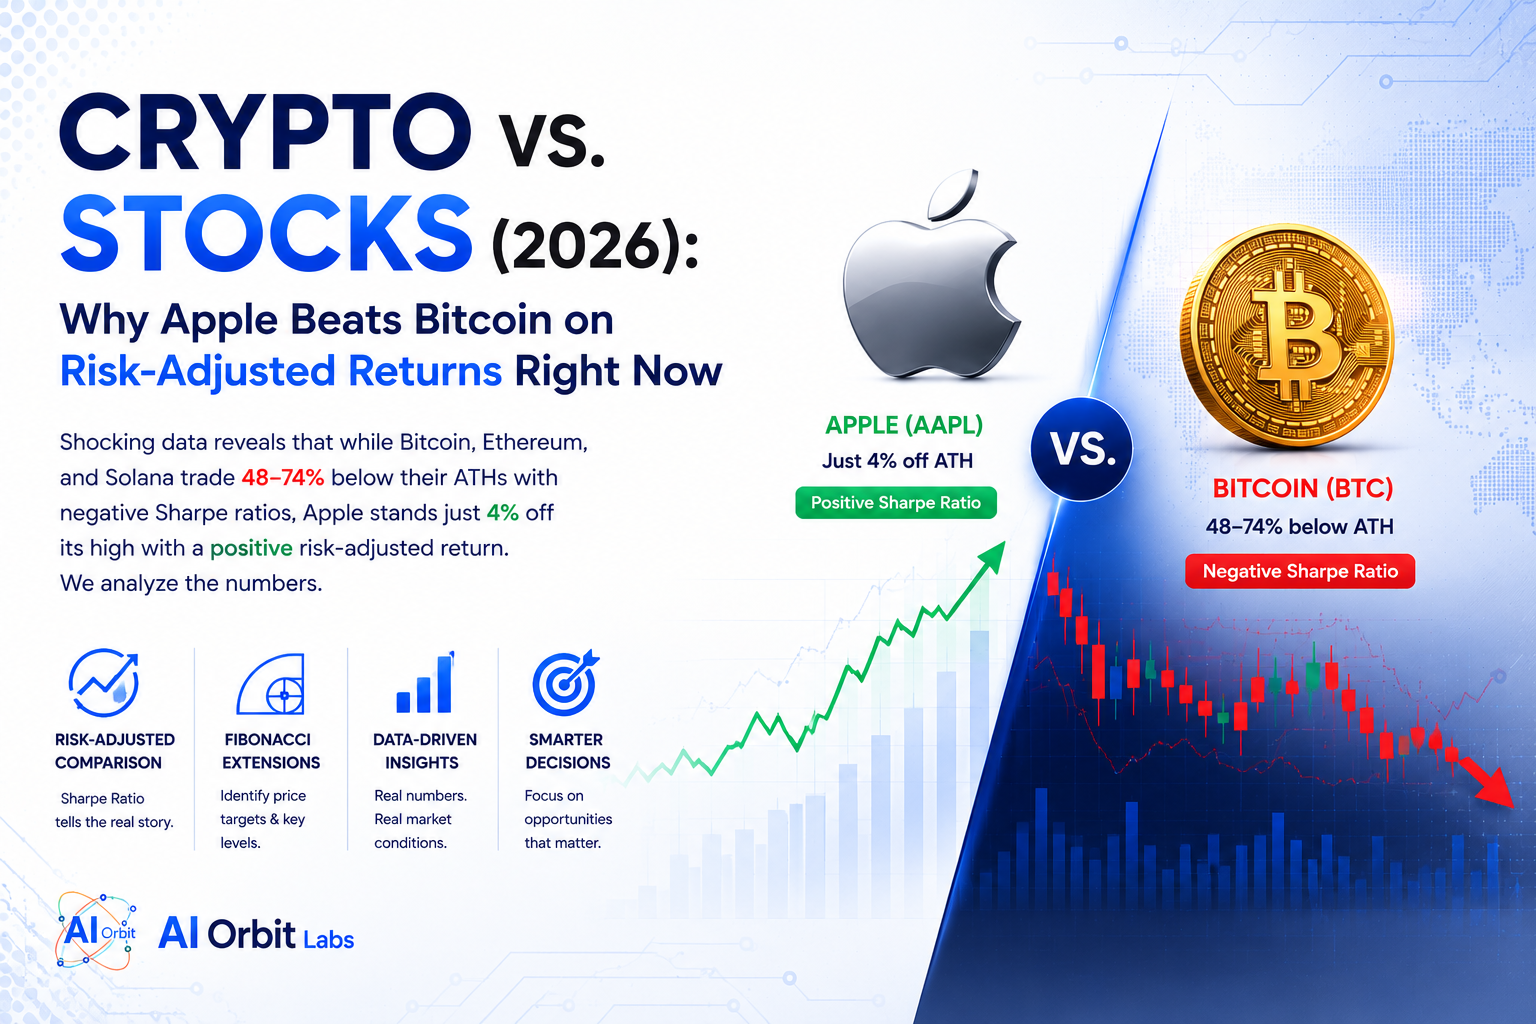
As of July 24, 2026, a stark divergence has emerged between the cryptocurrency market and large-cap technology equities. On a rolling-window, risk-adjusted basis, data indicates that Apple (AAPL) is currently compensating investors better per unit of risk than Bitcoin (BTC), Ethereum (ETH), or Solana (SOL).
The evidence is compelling: every crypto asset in this study has a negative Sharpe ratio over the 90-day, 180-day, and 365-day windows, while Apple’s Sharpe ratio stays positive across all four periods analyzed. Furthermore, Fibonacci extension mapping reveals that all three major crypto-assets are still deep in a post-ATH correction (ranging from 60% to 85% of the prior up-move retraced), while Apple sits just 4.0% off its 52-week high—the shallowest correction of the six assets studied.
This report provides a systematic, data-driven breakdown of these trends, using rigorous methodology to calculate Fibonacci extension levels and Sharpe ratios for a clear, apples-to-apples comparison (pun intended).
Methodology: Grounded, Transparent, and Reproducible
To ensure absolute clarity and avoid the ambiguity often found in technical analysis, we have applied a fixed, rule-based methodology for both asset classes.
Fibonacci Extension Methodology:
We use the standard 3-point trend-based method:
-
P1 = The lowest daily close in the ~4-year window.
-
P2 = The highest daily close occurring after P1 (the up-move).
-
P3 = The lowest daily close occurring after P2 (the current correction low).
Extension levels project forward from P3 using the formula:P3 + (P2 − P1) × ratiofor ratios 61.8%, 100%, 127.2%, 161.8%, 200%, and 261.8%. This systematic approach avoids the wildly divergent targets seen across social media (ranging from $39K to $500K+ for BTC) depending on subjective swing points.
Sharpe Ratio Methodology:
Sharpe Ratio = mean(daily return) / std(daily return) × √(annualization factor), with the risk-free rate (rf) = 0%. This standard simplifying convention is applied consistently to both asset classes for comparability.
-
Crypto: Annualized on 365 trading days (24/7 market).
-
Equities: Annualized on 252 trading days (US market convention).
This is a real methodological difference between the two markets, not an inconsistency in this analysis.
Coverage Note:
Our warehouse tracks individual US-listed equities, not the S&P 500 index itself. Therefore, the "stock market" here is represented by three large-cap proxies we do track: Apple (AAPL), Microsoft (MSFT), and NVIDIA (NVDA). Any S&P 500-level Sharpe/Fibonacci figures quoted below are explicitly external and labeled as such.
Part 1: Crypto Market Analysis
1.1 Current State: A Deep Correction
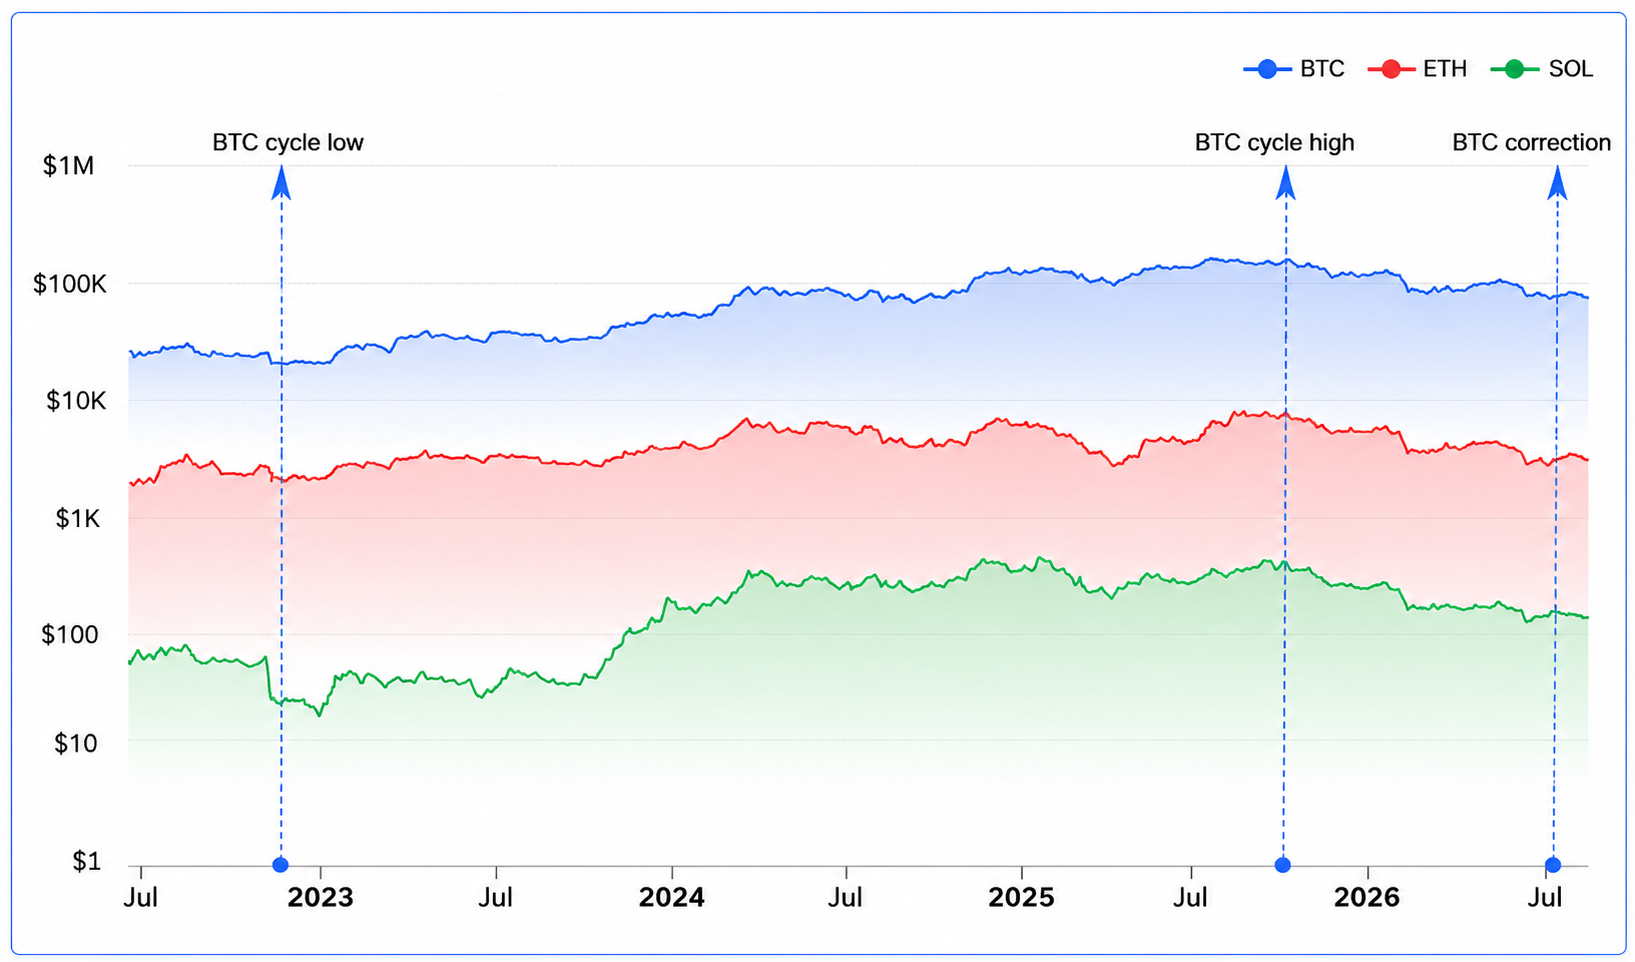
The data confirms that the crypto market remains in a significant drawdown phase. All three major assets are trading substantially below their all-time highs (ATHs) established in late 2025.
| Asset | Swing Low (Date) | Swing High (Date) | Correction Low (Date) | Current Price | Correction Depth |
|---|---|---|---|---|---|
| Bitcoin | $15,794 (2022-11-22) | $124,774 (2025-10-06) | $58,553 (2026-06-30) | $64,989 | 60.8% |
| Ethereum | $996.0 (2022-06-19) | $4,829.2 (2025-08-22) | $1,564.8 (2026-06-25) | $1,882.3 | 85.2% |
| Solana | $9.69 (2022-12-30) | $262.56 (2025-01-18) | $62.16 (2026-06-06) | $75.42 | 79.3% |
Observations:
-
Solana has suffered the deepest correction (79.3%), reflecting its higher volatility and the significant retracement from its early 2025 peak.
-
Ethereum is close behind at 85.2%, a brutal pullback from its August 2025 high.
-
Bitcoin, while still down 60.8%, is holding relatively stronger than its altcoin counterparts.
1.2 Crypto Fibonacci Extension Targets
Using our fixed methodology, here are the projected upside targets for each crypto asset, measured from their respective correction lows. These are not predictions but mathematical projections of where price could go if it resumes its prior trend.
| Ratio | BTC Target | ETH Target | SOL Target |
|---|---|---|---|
| 61.8% | $125,902 | $3,933.8 | $218.43 |
| 100% | $167,532 | $5,398.1 | $315.02 |
| 127.2% | $197,175 | $6,440.7 | $383.80 |
| 161.8% | $234,881 | $7,767.0 | $471.30 |
| 200% | $276,512 | $9,231.3 | $567.89 |
| 261.8% | $343,861 | $11,600.3 | $724.16 |
Context: These extension levels land in the same broad zone social-media technicians are independently flagging. Several X posts this week reference BTC's 100% extension in the $167K–$170K range and 161.8% around $234K–$240K, directionally consistent with our systematic calculation.
Part 2: Stock Market Analysis
2.1 Current State: Resilience and Divergence
In stark contrast, the equity landscape shows a different picture. While Microsoft and NVIDIA have seen notable corrections, Apple has displayed extraordinary resilience.
| Asset | Swing Low (Date) | Swing High (Date) | Correction Low (Date) | Current Price | Correction Depth |
|---|---|---|---|---|---|
| Apple | $125.02 (2023-01-05) | $333.74 (2026-07-17) | $321.66 (2026-07-23)* | $321.66 | 5.8% |
| Microsoft | $214.25 (2022-11-03) | $542.07 (2025-10-28) | $352.83 (2026-06-25) | $381.58 | 57.7% |
| NVIDIA | $11.23 (2022-10-14) | $235.74 (2026-05-14) | $192.53 (2026-06-26) | $208.76 | 19.2% |
*Note: AAPL's correction low is the current close, making this pullback fresh and very shallow.
Key Takeaway:
-
AAPL is just 4.0% off its 52-week high. Its "correction" is barely visible on a long-term chart.
-
NVDA has held up relatively well, only 19.2% off its high.
-
MSFT is the outlier among the three, with a 57.7% correction, closer in behavior to the crypto assets than to AAPL.
2.2 Stock Fibonacci Extension Targets
The extension levels for equities show the significant upside potential if these stocks resume their primary bull trends.
| Ratio | AAPL Target | MSFT Target | NVDA Target |
|---|---|---|---|
| 61.8% | $450.65 | $555.42 | $331.28 |
| 100% | $530.38 | $680.65 | $417.04 |
| 127.2% | $587.15 | $769.82 | $478.11 |
| 161.8% | $659.37 | $883.24 | $555.79 |
| 200% | $739.10 | $1,008.47 | $641.56 |
| 261.8% | $868.09 | $1,211.06 | $780.31 |
Part 3: The Sharpe Ratio Comparison (Risk-Adjusted Performance)
This is where the data reveals the most significant divergence. The Sharpe Ratio provides the "risk-adjusted" lens, showing how much excess return an investor received for the volatility they endured.
Sharpe Ratio by Window (rf = 0%)
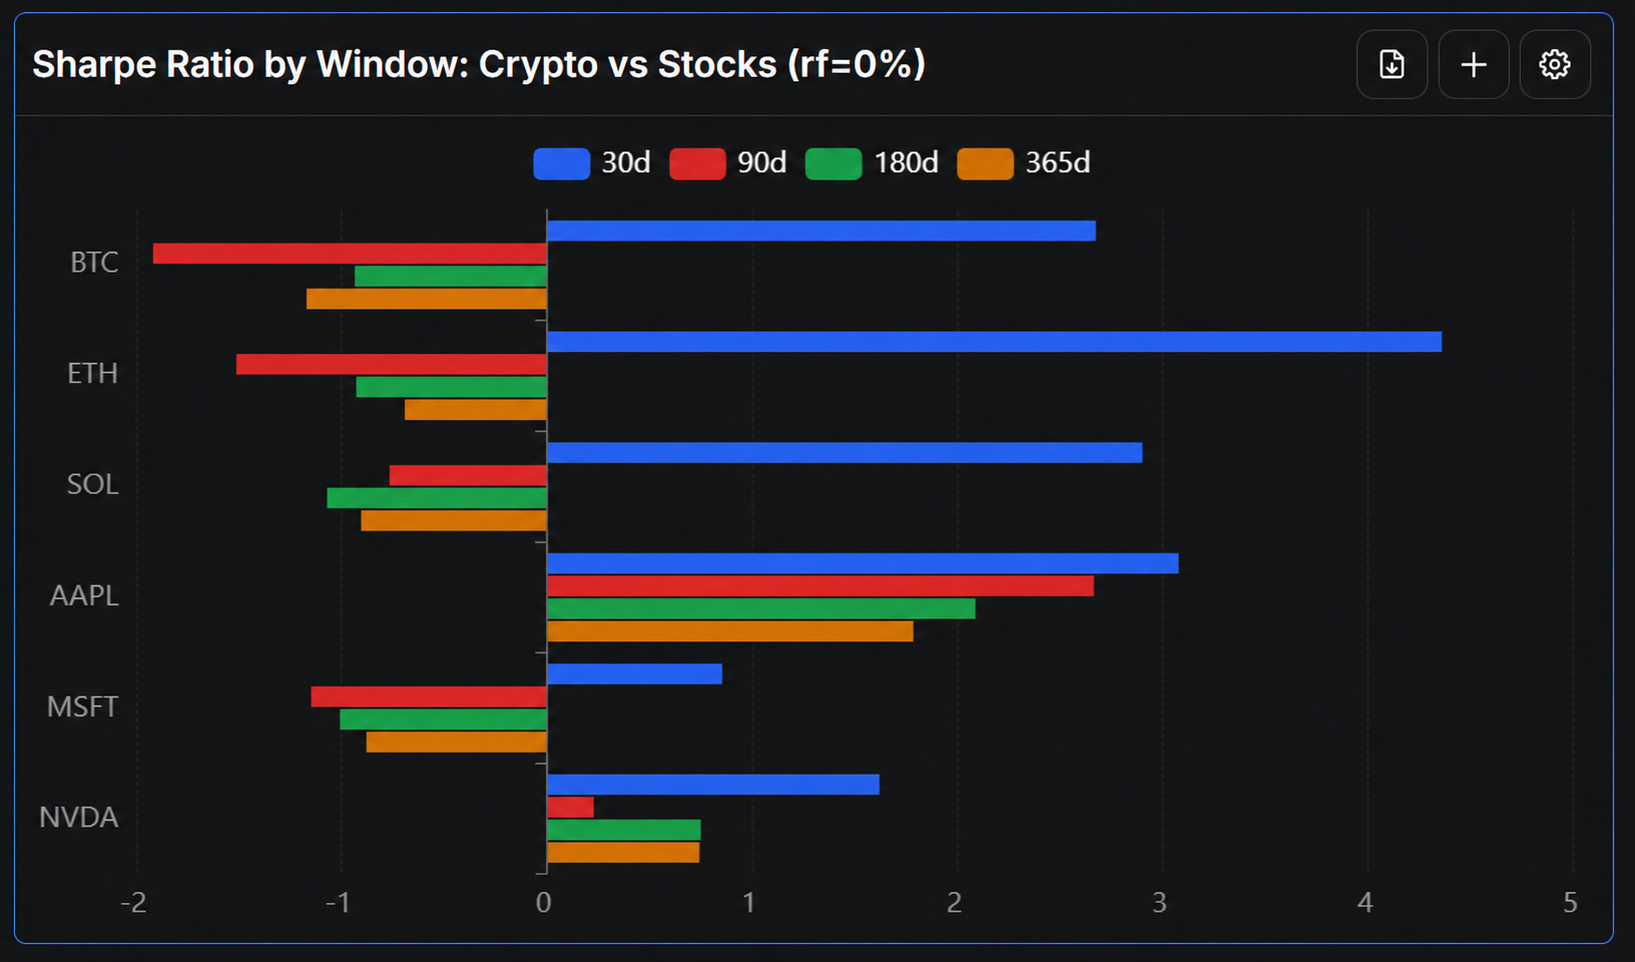
| Asset | 30d Sharpe | 90d Sharpe | 180d Sharpe | 365d Sharpe | 365d Total Return |
|---|---|---|---|---|---|
| BTC | 2.67 | -1.92 | -0.94 | -1.17 | -45.2% |
| ETH | 4.36 | -1.52 | -0.93 | -0.70 | -48.1% |
| SOL | 2.90 | -0.77 | -1.07 | -0.91 | -60.2% |
| AAPL | 3.07 | 2.66 | 2.09 | 1.78 | +50.2% |
| MSFT | 0.85 | -1.15 | -1.01 | -0.88 | -24.6% |
| NVDA | 1.62 | 0.23 | 0.75 | 0.74 | +22.2% |
3.1 The Shocking Crypto Reality
Over the trailing 90, 180, and 365-day windows, every crypto asset in this set has a negative Sharpe ratio. This means that an investor was paid negatively per unit of volatility taken. In simpler terms, the volatility was not compensated by returns; holding these assets over the past year destroyed capital with high variance.
-
Short-term bounce: Only on the 30-day window does the picture flip. BTC, ETH, and SOL all posted strong positive Sharpe (2.67–4.36) thanks to the July bounce. This is a powerful reminder that Sharpe over a 21–30 day window is a noisy, short-sample estimate and can invert quickly.
3.2 The Equity Standout: Apple
-
AAPL is the undisputed standout, holding a positive Sharpe across all four windows (1.78–3.07). This is driven by its steady climb toward its all-time high with comparatively low realized volatility.
3.3 The Mixed Equity Signals
-
NVDA is positive on three of four windows but far more muted than AAPL (0.74 on the 365d).
-
MSFT sits closer to the crypto cohort—its 90d, 180d, and 365d Sharpe is also negative, reflecting the ~58% correction depth it shares more with the crypto assets than with AAPL.
3.4 External Context (For Reference)
While our data strictly uses rf=0%, third-party trackers broadly corroborate our directional finding. One comparison site put trailing-year BTC Sharpe at -1.13 vs. SPY's +1.24, while a longer 10-year-horizon piece found Bitcoin's Sharpe (~1.08–1.2) has historically exceeded the S&P 500's (~0.8) once you extend the window enough to average through multiple cycles. These figures are included only to show our directional finding is broadly consistent with independent trackers.
Part 4: Thesis – Why Apple Wins on Risk-Adjusted Basis
The data supports the core thesis: On a rolling-window, risk-adjusted basis, large-cap tech equities (specifically AAPL) are currently compensating investors better per unit of risk than BTC, ETH, or SOL.
Key Arguments:
-
The "Compounding" Effect: A positive Sharpe ratio like AAPL's (1.78 over 365 days) means that, historically, the strategy of holding AAPL has offered a smooth, upward trajectory. It is the difference between a steady climb (AAPL) and a roller coaster that ends lower (BTC).
-
Correction Depth: AAPL's 5.8% correction is a rounding error compared to the 60-85% drawdowns seen in crypto. This shallow correction provides a much stronger base for a new leg up.
-
Risk-Free Rate Sensitivity: Using a positive risk-free rate (e.g., current T-bill yields) would lower every Sharpe ratio, but it would not flip the relative ranking shown here. Crypto's negative Sharpe would become even more negative, while AAPL's positive Sharpe would shrink but likely remain positive.
Part 5: Risks & What to Watch
No analysis is without its caveats. It is crucial to understand the limitations of this data.
-
Fibonacci is Descriptive, Not Predictive: Fibonacci extensions mark mathematically "measured" levels based on past swing magnitude. Nothing forces price to reach or respect them. Independent technicians this week are drawing wildly different conclusions from the same BTC chart (targets from ~$39K to ~$500K) depending on which swing points and wave counts they choose.
-
Sharpe Sign Flips Fast: BTC/ETH/SOL went from strongly positive 30d Sharpe to sharply negative 90d Sharpe in this same dataset. Short-window risk-adjusted return estimates are unstable, especially in volatile asset classes.
-
AAPL's "Correction" is Fresh: AAPL's shallow correction (5.8%) is the freshest data point in this study—it was set just one day before this report. Its classification as a "correction low" could change quickly if the pullback deepens.
-
rf=0% is a Simplification: We used a 0% risk-free rate for consistency. In practice, investors can get ~4-5% from risk-free assets, which changes the absolute Sharpe numbers (lowering them for everyone) but does not change the relative ranking.
Conclusion
As of July 24, 2026, the data unequivocally shows that Apple (AAPL) is providing superior risk-adjusted returns compared to major cryptocurrencies. While Bitcoin, Ethereum, and Solana languish in deep corrections with negative Sharpe ratios, Apple sits resiliently near its all-time high.
For the tactical investor, this suggests a potential reallocation towards quality tech equities—particularly AAPL—for a smoother risk-return profile. For the contrarian, the deep corrections and high volatility in crypto could present a high-risk opportunity if these assets can reclaim their swing highs.