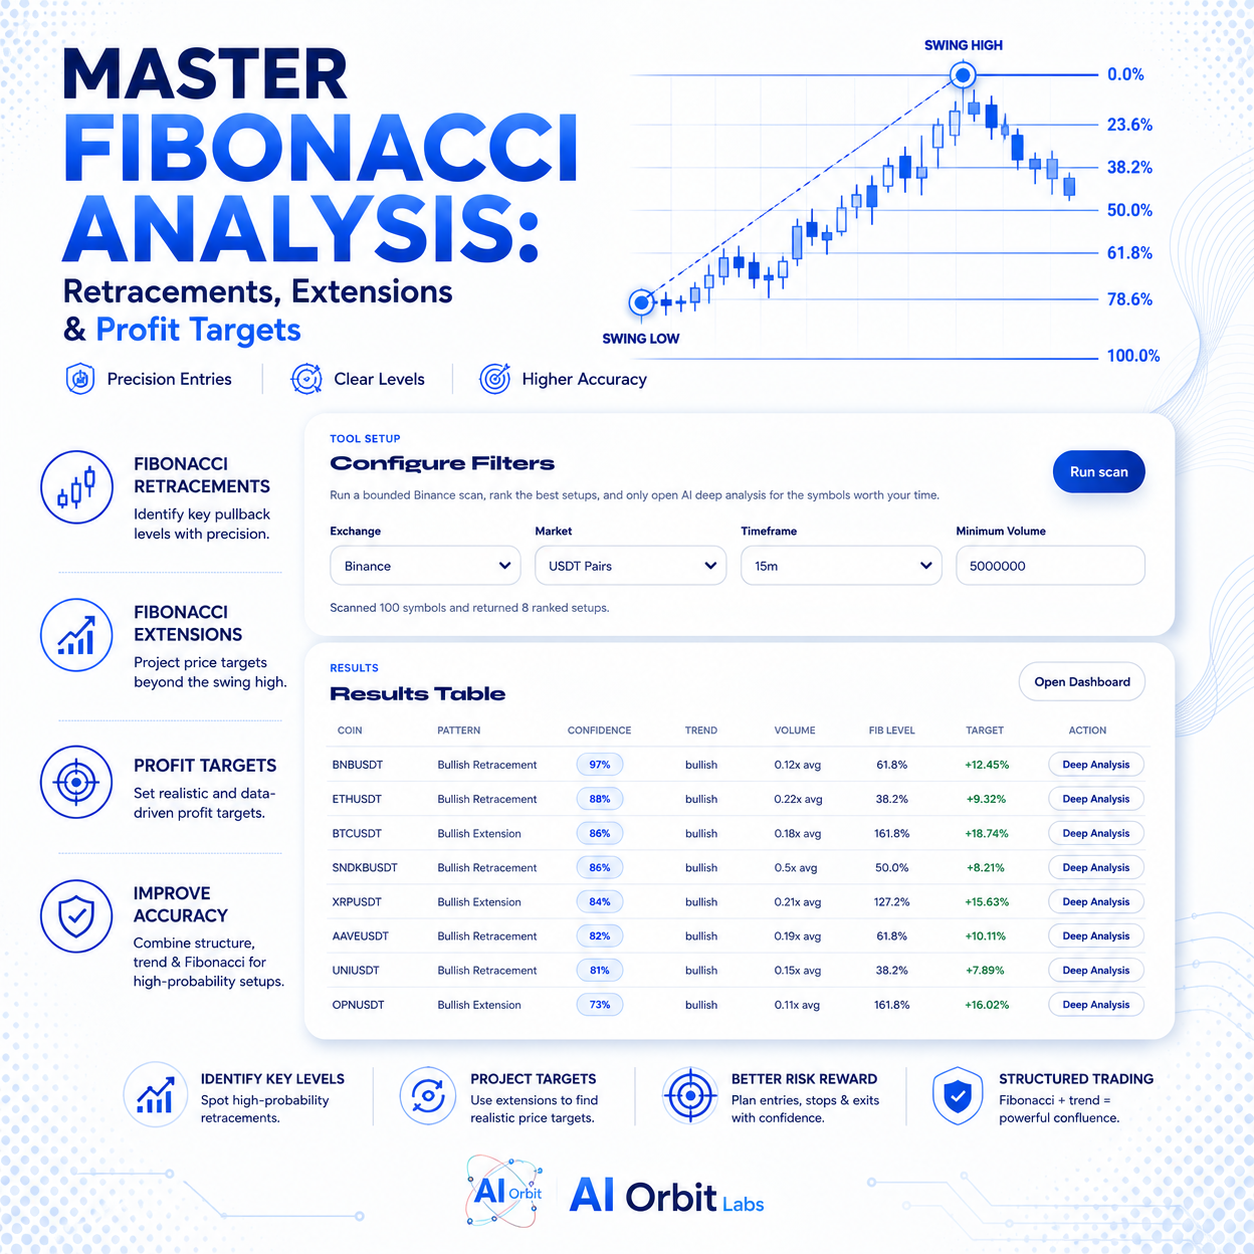
The difference between a winning trade and a losing one often comes down to precision. You might have the right direction, but entering too early or exiting too late can turn a winning setup into a losing one. This is where Fibonacci Analysis becomes an indispensable tool for traders.
The AI Orbit Labs Fibonacci Analysis module is designed to cut through the noise. It provides clear, structured data on retracements, extensions, and projections, helping you plan your trades with surgical accuracy. Built to integrate seamlessly with our broader Trading Hub—including the Breakout Scanner and dashboards—this tool gives you the actionable context you need to execute high-probability trades.
In this comprehensive guide, we will explore the core concepts of Fibonacci trading, how this specific tool provides a unique edge, and how you can integrate it into your daily trading workflow to maximize your profitability.
Part 1: What is Fibonacci Analysis in Trading?
Fibonacci analysis is a technical trading method based on the mathematical relationships discovered by the 13th-century mathematician Leonardo Fibonacci. These ratios, such as 0.618 (the Golden Ratio), 0.382, and 0.236, appear frequently in nature, architecture, and, fascinatingly, financial markets.
In trading, these ratios are used to identify potential levels of support and resistance. The core idea is that markets move in predictable waves: a sharp directional move (impulse) is often followed by a corrective pullback (retracement). After the retracement, the market often continues in the direction of the original impulse.
The key Fibonacci tools are:
-
Retracements: Used to identify potential support or resistance levels during a pullback. Common levels include 0.382, 0.5, and 0.618.
-
Extensions: Used to project potential price targets beyond the original move, often as the market continues its trend.
-
Projections: A more advanced tool that combines two price swings to predict a target for a third swing, often used in complex wave patterns.
The AI Orbit Labs module simplifies these complex calculations, presenting them in a clean, actionable format so you can focus on strategy, not math.
The Origin: Leonardo Fibonacci and the Golden Ratio
Leonardo Fibonacci introduced the Hindu-Arabic numeral system to Europe through his book Liber Abaci in 1202. However, his greatest legacy to modern trading is the sequence of numbers named after him. Starting with 0 and 1, each subsequent number is the sum of the two preceding ones: 0, 1, 1, 2, 3, 5, 8, 13, 21, 34...
The Golden Ratio (0.618) is found by dividing any number in the sequence by the following number. This ratio appears so frequently in the natural world and human behavior that many traders believe it also governs the ebb and flow of crowd psychology in financial markets.
Part 2: The Three Pillars of Fibonacci Analysis
To effectively use the Fibonacci Analysis module, you must understand the three distinct functions it performs.
1. Fibonacci Retracements
Retracements are the most popular Fibonacci tool. They are used during a price correction to guess where the market might find support (in an uptrend) or resistance (in a downtrend).
-
How it works: You identify a significant swing high and swing low. The tool then draws horizontal lines at the key ratios (23.6%, 38.2%, 50%, 61.8%, 78.6%) between these two points.
-
The "Holy Grail" Levels: The 0.618 (61.8%) and 0.382 (38.2%) levels are the most watched. A retracement to the 0.618 level is often considered a "deep pullback," while a shallow pullback to 0.382 indicates strong momentum.
-
Trading Implication: If a coin is in a strong uptrend and pulls back to the 0.618 level before bouncing, many traders will enter long positions here, placing a stop-loss just below the 0.786 level.
2. Fibonacci Extensions
While retracements help you find an entry, extensions help you find an exit. Extensions project where the price is likely to go after the pullback is over.
-
How it works: You plot three points: the start of a move (Swing 1), the end of the move (Swing 2), and the end of the retracement (Swing 3). The tool projects levels like 1.272, 1.382, 1.618, and 2.0 beyond Swing 2.
-
Key Targets: The 1.618 extension is the primary profit target for most traders. It often acts as a powerful magnet for price and frequently marks the end of a wave. The 1.272 extension is a more conservative "safe" target.
3. Fibonacci Projections
Projections are similar to extensions but are calculated using a different wave structure. They are specifically used to predict the length of the next leg in a sequence (e.g., the third wave in an Elliott Wave cycle).
-
How it works: It uses the length of a previous swing (Wave 1) and projects it from the end of the retracement (Wave 2) to predict the length of the next move (Wave 3).
-
Trading Implication: If you correctly identify a Wave 2 retracement, the 1.618 projection of Wave 1 gives you a highly reliable target for the upcoming Wave 3 impulse.
Part 3: How the Fibonacci Analysis Module Works (Quick Input to Output)
The Fibonacci Analysis page is part of our "Trading Workflow" designed to provide actionable context quickly. The interface is structured for clarity, allowing you to move from Quick Input to Module Output without unnecessary friction.
While the page is currently a robust module ready to support scanners and dashboards, its future iterations will deliver even deeper insights. Here's what you can expect from the module now and going forward:
-
Quick Input: This is your starting point. You can input key swing points (highs and lows) or select a specific asset and timeframe. The module is designed to "hook" into the broader Trading Hub ecosystem, so in the future, you might be able to send a scanner result directly to the Fibonacci tool for instant analysis.
-
Module Output: The results section is where the magic happens. This is where the tool will display the key Fibonacci levels visually and numerically:
-
Retracement Levels: Potential support/resistance zones for a pullback (e.g., 0.236, 0.382, 0.5, 0.618, 0.786).
-
Extension Levels: Potential profit targets for a breakout (e.g., 1.272, 1.618, 2.0, 2.618).
-
Price Zones: The tool highlights confluence zones where multiple levels cluster, indicating higher-probability reaction areas.
-
This module is not a black box. It provides transparent, calculated levels that you can use to validate your existing analysis or discover new trading opportunities.
Part 4: The Three Trading Edges of Fibonacci Analysis
The module is built on three core principles, designed to enhance your trading process beyond just drawing lines on a chart.
Trading Edge 1: Actionable Precision for Execution Planning
The primary purpose of Fibonacci analysis is execution planning. It tells you where to enter, where to place your stop-loss, and where to take profit. The AI Orbit Labs module is designed to support this directly. You don't get vague signals; you get specific, calculable price levels. This removes subjectivity from your trading, forcing you to be disciplined.
Trading Edge 2: Seamless Integration with Your Workflow (Scanner + Dashboard)
This tool is not a standalone island. It's built to support scanners and dashboards. For example, after identifying a potential breakout setup using the Breakout Scanner, you can use this module to determine the precise retracement level to enter on a pullback, and the extension level to take profit. This creates a cohesive, powerful workflow where tools complement each other.
Trading Edge 3: Clear, Actionable Context
The module is structured for clarity. In a world of noisy charts and conflicting indicators, this tool provides structured data that you can trust. It’s about giving you a clear roadmap, not a guessing game. The "Actionable context" section ensures that you see not just the numbers, but the implications of those numbers in the current market regime.
Part 5: How to Integrate Fibonacci Analysis into Your Strategy
Knowing what Fibonacci levels are is one thing; knowing how to use them is another. Here are some practical trading strategies you can implement with the Fibonacci Analysis module.
Strategy 1: The Pullback Entry (Using Retracements)
This is the most common and reliable use case. After a strong move up or down, the price often pulls back to a Fibonacci level before resuming its trend.
-
Identify the Trend: Use a scanner to find coins with strong momentum and a clear directional bias.
-
Mark the Swing: Identify the swing high and swing low that define the move. This is your "impulse" wave.
-
Input the Points: Enter these points into the Fibonacci Quick Input module.
-
Enter on the Retracement: Wait for the price to pull back to a key level, such as the 0.382 or 0.618 retracement. Look for a bullish reversal candlestick pattern (like a hammer or engulfing candle) at this level for confirmation.
-
Set Your Stop-Loss: Place your stop-loss just below the next Fibonacci level (e.g., if entering at 0.618, place the stop-loss below 0.786 to give it room to breathe).
-
Target Profit: Use the extension levels (e.g., 1.272 or 1.618) displayed in the Module Output to set your profit targets.
Strategy 2: The Breakout Play (Using Extensions)
When a market breaks out of a range, Fibonacci extensions can help you project where the price is heading, preventing you from taking profits too early.
-
Identify the Breakout: Use a volume scanner to detect a breakout with strong volume.
-
Identify the Swing: Use the impulse leg (the move just before the breakout consolidation) as your base swing.
-
Set Targets: The Module Output will project extension levels. The 1.618 extension is often a powerful magnet for price. Many traders take 50% profits at 1.272 and scale out the rest at 1.618 or 2.0.
Strategy 3: Confluence Analysis (Combining Fibonacci with Other Tools)
Fibonacci works best when combined with other tools. Look for areas where a Fibonacci level aligns with:
-
A major moving average (e.g., 50 or 200 EMA).
-
A previous support or resistance zone.
-
An oversold/overbought reading on an oscillator like the RSI.
-
A high-confidence signal from the Breakout Scanner.
When multiple tools point to the same price zone (confluence), the probability of a reaction increases significantly. The Fibonacci module is designed to be used in tandem with these other analyses.
Part 6: Advanced Concepts: Fibonacci Extensions vs. Projections
While retracements are widely understood, extensions and projections are often overlooked. Here’s a deep dive into these powerful tools.
Understanding Fibonacci Extensions in Detail
Extensions are used to project where price might go after a pullback. The classic setup uses three swing points: a move up (Swing 1 to Swing 2), a pullback (Swing 2 to Swing 3), and a projection higher (Swing 3 onward).
-
1.272 Extension: Often the first "safe" target. This is a shallow target that often acts as initial resistance.
-
1.618 Extension: A major target. This is the "gold standard" for taking full profits. It often signals a top or bottom for that specific move.
-
2.0 and 2.618 Extensions: Rare, but when hit, they indicate extreme momentum and potential blow-off tops. Traders often use these to scale out a small portion of their position for massive gains.
Understanding Fibonacci Projections in Detail
Projections are similar but are calculated using a specific wave structure. They are particularly useful for traders who follow Elliott Wave theory.
-
Min Wave: Typically uses the 1.0 to 1.618 projection of Wave 1 into Wave 3.
-
Max Wave: Sometimes projects up to the 2.618 level.
The AI Orbit Labs Fibonacci Analysis module is designed to handle these complex calculations, delivering the numbers instantly so you can focus on strategy, not manual arithmetic.
Part 7: The Future of the Fibonacci Analysis Module
The current page is a robust foundation, but the roadmap includes deeper integration and more advanced features:
-
Direct Scanner Integration: In the future, you will be able to click a button on a scanner result to instantly load that asset's data into the Fibonacci Analysis module. No more manual entry of swing points.
-
Automated Swing Point Detection: The AI will learn to identify significant swing highs and lows automatically, reducing manual work and subjectivity.
-
Multi-Timeframe Confluence: The module will highlight levels that are significant across multiple timeframes (e.g., a 0.618 retracement on the 1-hour chart that also aligns with the 200-day moving average).
-
Dashboard Integration: Key Fibonacci levels will be fed directly into the user's personal dashboard, creating a persistent watchlist of high-confluence zones that you can monitor in real-time.
Part 8: Risk Management with Fibonacci
A powerful tool must be paired with strict risk management. Fibonacci levels can help structure your risk-reward (R:R) ratio effectively.
Calculating R:R with Fibonacci
-
Risk: Defined as the distance from your entry (at a retracement level) to your stop-loss (below the next retracement level).
-
Reward: Defined as the distance from your entry to your target (extension level).
-
Ideal Ratio: Using Fibonacci, you can easily ensure you are risking 1 to make 1.5 or 1 to make 2. For example, entering at 0.618, stopping at 0.786, and targeting 1.618 often yields a favorable risk-reward ratio.
The 50% Rule
Many traders use the 0.5 retracement level as a psychological line in the sand. If the price breaks through the 0.5 level, it signals weakness in the original trend. If it holds above 0.5, the bulls are in control. The Fibonacci module highlights this level prominently to help you gauge the strength of the retracement.
Part 9: Conclusion
Fibonacci Analysis is a cornerstone of technical trading, offering a mathematical framework for identifying key price levels and planning trades. The AI Orbit Labs Fibonacci Analysis module takes this powerful concept and makes it accessible, actionable, and integrated.
Whether you're using it to find the perfect pullback entry or to project a massive upside target, this tool provides the "actionable context" you need to trade with confidence. Combined with our other free modules, like the Breakout Scanner, it forms a comprehensive ecosystem designed to give you a real edge in the crypto markets.
Ready to trade with precision? Visit the Fibonacci Analysis module and start planning your next high-probability trade.
https://aiorbitlabs.com/trading-hub/fibonacci-analysis/